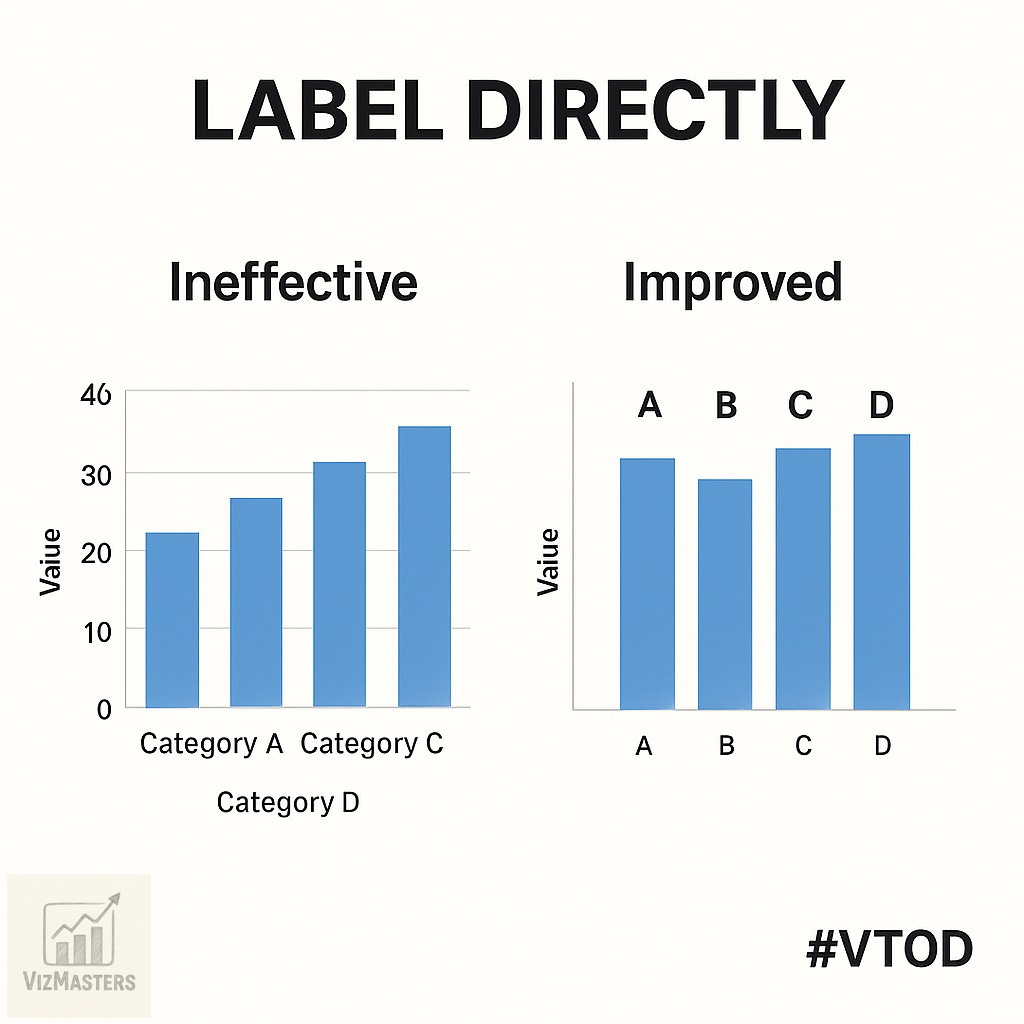
VizMasters Tip Of Day (VTOD #18): Directly label important points or anomalies instead of leaving the user to guess.
VTOD #18 – Avoid Chart Junk

VTOD #18 – Avoid Chart Junk
Chart junk refers to all the unnecessary or distracting elements in a chart like 3D effects, heavy gridlines, drop shadows, and too many colors. Clean visuals help your audience focus on what truly matters: the data story.
Let your data breathe. Every line, shade, or effect should serve a purpose. Simplify, don’t amplify. Remove distractions, and your data's message will shine through.
#DataVisualization #Minimalism #VizMasters #ClarityMatters