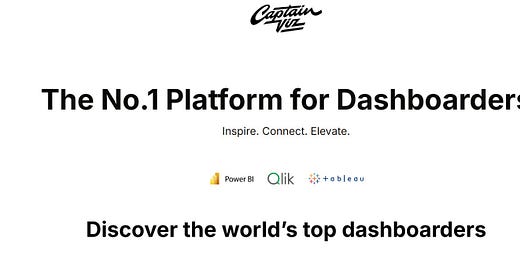
Find Dashboard Ideas and Inspiration on CaptainViz
Designed for data professionals who value clarity and design.
If you enjoy creating dashboards or love working with data, CaptainViz is a great place to visit. CaptainViz is a platform where people from all over the world share their best dashboards. Whether you use Tableau, Power BI, Qlik, or any other tool, you will find something useful here. This space is especially for data professionals caring about design and clarity.
A Note from the Author: I really enjoyed crafting this story from start to finish! After I completed the writing, I used ChatGPT to help polish the grammar and make it even easier to read, all while keeping my original thoughts intact.
What You Can Explore on CaptainViz
Beautiful Dashboards
You will see dashboards created by experts. These are not just for show; they are used in real projects and can give you ideas for your own work.Learn from Real Examples
Sometimes we get stuck while building dashboards. Looking at how others have solved similar problems can help a lot. CaptainViz gives you a chance to learn from real-world projects.Connect with Others
This is not just a website. It is a growing community of people who love dashboards. You can share your own work, learn from others, and become a part of something bigger.
How to Get Started
You can create your own profile and upload your dashboards. It is easy and free. Once you join, you will also get updates whenever something new is added.
If you want to keep learning and improving your skills, this is a good place to begin.
A big shout-out to the creator of CaptainViz, Alexandre Perrot, for building such a fantastic platform that brings together the best of the data visualization community. Your work continues to inspire and help countless professionals in the field; thank you!
Follow the CaptainViz page to stay updated and inspired.


